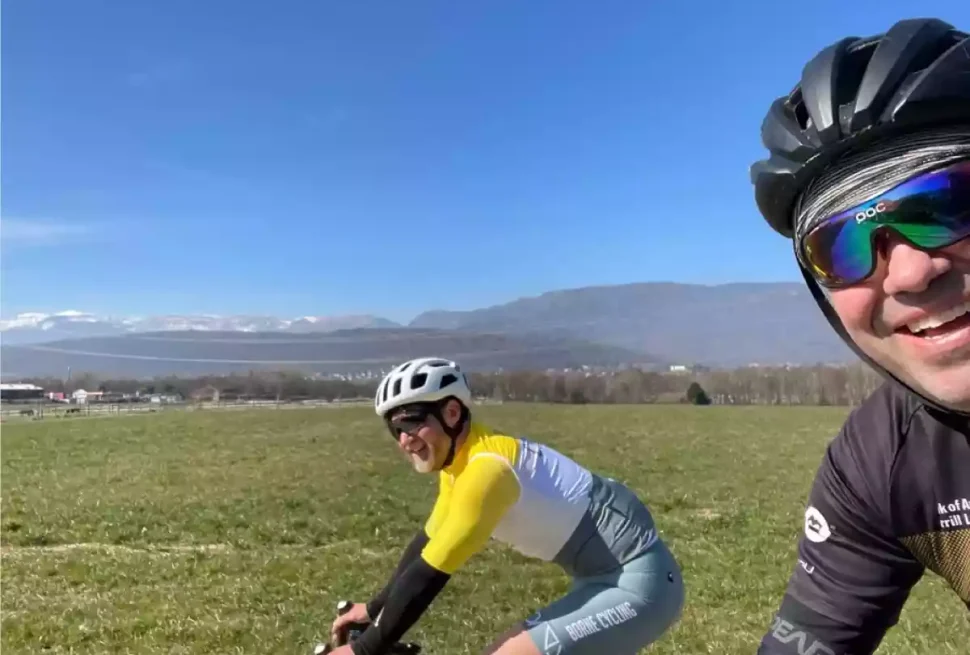
“What’s the gradient of the next climb, Paul?”
“Looks like 7% over 15km.”
“They’re always a 7% gradient, hey?”
Some time later…
“Paul, you bastard! I thought you said this was 7%? My Garmin is reading over 11%, and it doesn’t look like it’s easing off anytime soon!”
Have you ever been halfway up a climb when the gradient suddenly pitches up way beyond what you expected from the stats you checked before heading out?
On our recent trip down to Piemonte in North Western Italy, we tackled some absolutely first-class alpine cols. Strangely enough, on paper, almost every single one of them averaged around 7%:
- Colle del Nivolet (final 14km): 7%
- Colle dell’Agnello (final 16km): 7%
- Colle Fauniera (final 14km): 7%
Ride any of these, however, and I can guarantee you’ll swear they feel much steeper than a civilised 7%.
The Psychology of the Average
It turns out we rapidly discount the easier sections of any ascent. This makes sense: when the road flattens out or drops to a gentle slope, we ride faster, cover the distance quickly, and spend far less time on those stretch-your-legs segments.
When the gradient kicks up well above that advertised 7% average, however, our speed plummets. We spend significantly more time grinding away on the steep stuff, catching our breath, and watching our cadences drop. Naturally, these brutal sections hurt more, burning themselves into our memory far more vividly than the gentle rest stops along the way.
There seems to be a part of the cycling brain that hears the word average and instantly translates it to constant. We sub-consciously picture a steady 7% ramp from bottom to top without a single deviation.
How Averages Actually Work
That isn’t how maths or mountain roads work. For every flat section or gentle drag where you get to spin out the legs and bring your heart rate down, there must be an equally aggressive ramp to balance out the numbers. Because you travel slower on the steep bits, you end up spending the vast majority of your total ride time suffering on gradient percentages well above the mean.
Take the Col de la Colombière from Scionzier as a classic example. While the overall climb averages a manageable 6.5%, it features a 3km mid-section that loafs along at a gentle 2% to 3%. The catch? The final 3km averages almost 10%, serving up a punishing wall right when your legs are already spent.
It Happens In the Virtual World Too
I regularly notice this same “average ignorance” during Zwift group rides.
A ride leader might announce that an event will be paced at a steady 2.7 W/kg. Unless the course is dead flat, the effort level on the climbs will inevitably need to surge well above 2.7 W/kg. On any downhill section, the group barely puts down 1.0 W/kg, meaning the pace on the uphills has to compensate to bring the overall session average back to the target.
Without fail, riders flood the group chat complaining that the leader is pushing too hard. Yet, when the ride finishes and the summary screen pops up, the overall average power hits the advertised 2.7 W/kg spot on.
Look Beyond the Summary Number
The takeaway here is simple: an average stats line rarely tells the full story of a route.
The next time you ask a riding mate for the gradient of an upcoming climb, don’t just take the headline figure at face value. Take a proper look at the profile card, check where the steepest ramps hide, and make sure you’re properly forewarned for what’s coming.
Just don’t expect it to feel like 7% all the way up.